Real Estate Information Archive

Blog

Displaying blog entries 21-30 of 45

The Impact of Student Loan Debt on Housing and Younger Generation Ability to Purchase

by Tom Stachler,ABR,CDPE - Group One Realty Team

Over the past year, the National Association of REALTORS® (NAR) has become increasingly concerned about the impact of student debt on Home ownership and the overall economy. The U.S. currently has a whopping student debt load of $1.3 trillion, which accounts for 10 percent of all outstanding debt. While student debt has risen, the homeownership rate has fallen, especially among younger generations. NAR’s second quarter 2016 Housing Opportunities and Market Experience (HOME) survey reports that roughly two-thirds of non-homeowners with student debt said they are generally not comfortable also paying for a mortgage. Furthermore, non-homeowners and younger adults with student debt are less likely to believe that they can qualify for a mortgage due to student loan repayment obligations.

To address the growing concern about student debt, NAR highlighted the issue during the 2016 REALTORS® Legislative Meetings & Trade Expo. The Regulatory Issues Forum featured U.S. Housing and Urban Development (HUD) Secretary Julián Castro, along with a panel of speakers, who discussed important regulatory changes that would ensure housing opportunities can exist for young people. At the Residential Economic Issues & Trends Forum, Senator Elizabeth Warren discussed Congressional efforts to alleviate the growing burden that student loan debt repayment is having on young adults, the housing market and the overall U.S. economy. Finally, the NAR Board of Directors adopted a policy that, “NAR should strongly support policy proposals to allow student loan borrowers to refinance into lower interest rates and to streamline income-based repayment programs. Additionally, NAR supports policy proposals that promote student loan simplification, clarity and education. NAR also shall ensure that mortgage underwriting guidelines related to student loan debt should become standardized and that they do not impair homeownership.”

In June, NAR partnered with the American Student Assistance (ASA) program SALT® to conduct a survey of student loan borrowers who are current in student loan repayment. The results of the survey demonstrated the impact and challenges that student loans have on housing, even among those who are managing to pay their bills on time. Among survey respondents, 67 percent received their loans from a four-year college, 31 percent from a two-year college, 27 percent from graduate/post-graduate school, and 11 percent from a technical college. Twenty-four percent were delayed by at least two years in moving out of a family member’s home after college due to their student loans. While 18 percent are currently homeowners, 17 percent live with friends or family and do not currently pay Rent.

NAR also continues to work with Congress and the Administration. NAR submitted letters of support for several pieces of legislation that have been introduced in Congress this year aimed at addressing the issue of student loan debt. Some of these legislative proposals address a variety of issues, including streamlining the student loan process and limiting repayment to 10 percent of a borrower’s income; allowing borrowers to refinance student loans at a reasonable interest rate or utilize an income-based repayment plan; and enhancing financial counseling options. Additionally, NAR worked with HUD to alleviate the burden of student debt for potential homebuyers by revising the calculation of student loan debt for Federal Housing Administration (FHA) loans.Among non-homeowners, 71 percent cite student loan debt as the factor delaying them from Buying a home. This is most frequently the case due to the fact that borrowers cannot save for a down payment because of their student debt. Among homeowners, 31 percent say student debt is impacting their ability to sell their existing home and move to a different home. The delay in buying a home among non-homeowners and homeowners is typically five years.

NAR and this broker remains committed to addressing the impact of student loan debt on the economy and housing market.


Tom Stachler is a licensed Broker and Builder based in the tri county area surrounding Ann Arbor Michigan.  Also specializing in the Saline, Dexter, Chelsea and Ypsilanti Markets.  Call Tom for assistance on houses, homes and condos to purchase, list or Lease.  Check out the helpful Links page and navigation tabs above. Looking to purchase a home, check out the all MLS Inventory link above for currently active properties in the Board of Realtors data base.  

Why You Should Own a Home in an A+ School District

by Tom Stachler,ABR,CDPE - Group One Realty Team

Whether you have children or not, it pays to buy in an area with great schools. Realtor.com® recently released a new study that identifies the price premium to buy a home in a strong public school district, as well as the top 10 districts garnering the highest home prices and demand from buyers.

School districts rising to the top are: Beverly Hills Unified in Los Angeles; Highland Park Independent School District in Dallas; Kenilworth School District No. 38 in Kenilworth, Ill.; Rocky River City School District in Cuyahoga, Ohio; Clear Creek Independent School District in Harris, Texas; and School Town Of Munster School District in Lake, Ind.

Realtor.com® compared homes located in school districts rated 9 or 10 on the GreatSchools.org 10 point scale to homes situated in districts rated six or less. The analysis shows homes within the boundaries of the higher rated public school districts are, one average, 49 percent more expensive – at $400,000 – than the national median of $269,000 and 77 percent more expensive than schools located within the boundaries of the lower ranked districts with a median of $225,000.

Houses located in these areas, on average, also move eight days faster than homes in below average school districts and sell four days faster – at 58 days – than the national average of 62 days. Additionally, properties within the boundaries of higher-rated school districts are viewed 26 percent more, on average, than the average home on realtor.com® (an indicator of buyer demand) and 42 percent more than homes in areas with below average schools. “It’s common knowledge that buyers are often willing to pay a premium for a home in a strong school district,” says Javier Vivas, research analyst for realtor.com®. “Our analysis quantifies just how good it is to be a seller in these areas. On average, homes in top-rated districts attract a price premium of almost 50 percent and sell more than a week faster than those located in neighboring lower ranked school districts.”

A look at the top school districts

The district with the second highest Home Price premium is Highland Park Independent School District in Dallas where homes are 632 percent more expensive at $1.8 million than the median home in Dallas County at $277,000. Homes in Highland Park are 3.7 times and 4.4 times more expensive, respectively, than neighboring districts of Coppell Independent School District in Coppell, Texas – rated 9 – with a median of $470,000 and Dallas Independent School District in Dallas – rated  5 – with a median of $400,000, respectively.Highest Price Premiums

In top-ranked Beverly Hills Unified School District, homes sell for 689 percent more, at $3.8 million, than other homes in Los Angeles County, at $550,000. That’s 1.6 times the premium of homes located in the Santa Monica-Malibu Unified School District – rated 9 – that covers Santa Monica, Calif. and Malibu, Calif. and has a median list price of $2.5 million. Beverly Hills’s price premium is 3.9 times more than Culver City Unified School District in Culver City, Calif. that has a rating of 8 and a median list price of $975,000.

Kenilworth School District No. 38 in Kenilworth, Ill., where homes carry a median sales price of $1.6 million, ranked third in the nation with its home price premium of 606 percent compared to Cook County. That’s 2.1 times more than the neighboring district of Wilmette Public Schools District 39 in Wilmette, Ill., rated 10 by GreatSchools, with a median list price of $780,000, and 1.2 times more than Winnetka School District 36  in Winnetka, Ill., rated 10, with a median list price of $1.4 million. Winnetka School District 36 is also ranked fifth in the nation for its home price premium.

Highest Demand from Home BuyersRounding out the Top 10 school districts with the highest price premiums are: Indian Hill Exempted Village School District – Hamilton, Ohio; Winnetka School District 36 – Winnetka, Ill.; Manhattan Beach Unified School District – Los Angeles; Scarsdale Union Free School District – Westchester, N.Y.; Saddle River School District – Bergen, N.J.; San Marino Unified School District – Los Angeles; and Mariemont City School District – Hamilton, Ohio. See chart below for additional detail.

The district with the highest home buyer demand – as measured by realtor.com® listing views compared to the surrounding county – is Rocky River City School District in Cuyahoga, Ohio, rated 10, where listings within district boundaries receive 2.8 times more views than other areas in Cuyahoga County. Homes in the Rocky River District also receive 1.7 and 1.5 times more listing views, respectively, than Westlake City School District in Westlake, Ohio ranked 9 by GreatSchools and Lakewood City School District in Lakewood, Ohio with a GreatSchools rating of 6.

Vivas adds, “While highly ranked school districts in these markets have pushed home prices higher than their surrounding areas, the majority of these high demand markets are relatively affordable when compared to the national median, which is a big factor contributing to their popularity.”

The second most popular school district in the nation for home buyers is Clear Creek Independent School District in Harris, Texas. It garners 2.2 times the listing views of Harris County and 1.2 and 1.0 times as many views, respectively, as nearby districts of Pasadena in Pasadena, Texas (rated 5) and La Porte Independent School District in La Porte, Texas.

Coming in as the third most viewed school district for home buyers,  School Town of Munster School District in Lake, Ind., has a GreatSchools rating of 9 and receives nearly 2.2 more listings views than other homes in the county. That’s 1.36 more views than neighboring district of School Town Of Highland Independent School District, rated 6, in Highland, Ind.

Completing the Top 10 list are Orange School District – New Haven, Conn.; Etiwanda Elementary School District – San Bernardino, Calif.; Longmeadow School District – Hampden, Mass.; Strongsville City School District – Cuyahoga, Ohio; Plymouth-Canton Community School – District Wayne, Mich.; and Regional School District 05 School – District New Haven, Conn.

For more School information and District Maps, please click here and look at the bottom of the realty resources page you will be directed to.  Its important to keep in mind that the most popular districts may not always be the state's top rated scholastically due to inventory supply and demand, but its generally safe to assume a "popular district" will be one providing superior results or resident satisfaction. 


tom, stachler, real estate, one, ann arbor, schools, saline, district, dexter, chelsea, ratings, best, ranked, ranking, high school, college, middle, elementary, education, rating, get the best schools as ranked by the experts

Economists Forecast Banner Year in Real Estate for 2016

by Tom Stachler,ABR,CDPE - Group One Realty Team

As we ring in a New Year, Housing News Report asked six prominent economists to forecast what 2016 will bring for the U.S. housing market.

For housing, 2015 was a strong year, with home sales high and home prices continuing to rise.

Overall, the economists surveyed were cautiously optimistic about 2016 when it comes to home prices, home sales, interest rates and the impact of loosening lending standards that have recently been introduced by government agencies. Since 2016 is a Presidential election year, the economists were cagey when it comes to regulatory changes to Fannie Mae and Freddie Mac.

Here’s what they are forecasting for 2016:

What will be the most important housing market trend(s) in 2016 and why?

Alex Villacorta, chief economist, Clear Capital: The two most important housing market trends to watch in 2016 will be the continued growth of rental rates and the moderating trend in home prices. The pattern seen in 2015 was largely characterized by a white-hot rental market, and if this continues, more households will likely choose to Rent over buy in 2016.

In addition to driving rental prices up and vacancy rates down, this trend disengages an increasing proportion of potential home buyers — evidenced by the lowest homeownership rate in almost 50 years. Adding insult to injury for the purchase market, increasing rental rates continue to make it more difficult for potential buyers to save up for a down payment.

In 2016 we’ll use data from Clear Capital’s Home Data Index to see, at a local level, when the tide turns from rental to purchase demand. Many markets are already hospitable for buyers, but we have yet to see the demand. This implies that consumer confidence and the inability to overcome the barriers to purchase are a real headwind to a fully engaged housing market, especially for first-time home buyers.

As the year evolves we’ll be watching both rent and purchase trends closely, as a waning pattern in rental prices will suggest that momentum is shifting to the broader housing market, which should result in a more robust price growth in 2016.

 
A headshot of Jonathan Smoke

Jonathan Smoke

Jonathan Smoke, chief economist, realtor.com: Demand for for-sale housing will grow and will continue to be dominated by older millennials, aged 25 to 34. This demographic has the potential to claim a third of home sales in 2016 and represent 2 million home purchases.

Two other demographics will also be dominant forces on the buy side but will also be a key part of providing the necessary inventory on the sell side. Gen-X is in prime earning years and thus is also experiencing improvements in their economic circumstances, which include more relocations and seeking better neighborhoods for their families. Older boomers are approaching — or already in — retirement and seeking to downsize or lock in a lower cost of living. Together, these two generations will provide much of the suburban inventory that millennials desire to start their own families.

Supply will also improve as a result of additional growth in new construction and particularly in more single-family construction. The growth will be in more affordable price points, which will help bring down the average new home prices and average size of new homes, which have grown dramatically so far in the recovery as builders principally focused on the move-up, luxury, and active adult segments.

Mortgage rates should also begin their long-anticipated ascent as the Federal Reserve attempts to “thread the needle” on influencing rates up without negatively impacting economic growth. The increases in mortgage rates will likely be lower than the increases in short-term interest rates created by Fed policy as global weakness and a strong dollar limit more pronounced movement in long bonds. Mortgage rates will also be volatile, moving up and down by day and week, similar to how we’ve seen the market in 2015, but the key difference will be a more pronounced longer trend towards higher rates.

New Home Sales & NAR Existing Home Sales - Jan05-Dec15

The move up in mortgage rates should be a net positive to the market as fence-sitting sellers and buyers begin to understand that rates are moving higher and decide to jump into the market while they remain at such historically low levels.

The final key trend is that rents will rise more rapidly than prices, adding to the already burdensome level of rents that exist in more than 85 percent of the markets in the country. In the near term, this reinforces the consumer’s decision to buy, but higher rents also start to negatively impact the pipeline for future purchases by keeping renting households from saving towards a down payment.

Where is the housing market headed in 2016?

Douglas Duncan, chief economist, Fannie Mae: Lots of discussion of the need for subsidy but the real problem is lack of income growth for low and moderate income households. There will be a discussion of the regulatory cost of land development which is an inhibitor to production of low to moderate income affordable housing. Rents will remain strong as a result.

A headshot of Matthew Gardner

Matthew Gardner

Matthew Gardner, chief economist, Windermere: I expect that we will see more homes for sale. Homeowner equity started to recover in 2013 and has been steadily improving since that time.  As such, I expect that it will increase their likelihood of selling. At last — more inventory!  But I fear that it will still fall short of the supply needed to match demand.

Mark Zandi, chief economist, Moody’s Analytics: The most important housing market trend in 2016 will be the developing housing shortage. New housing construction has picked up in recent years, but it remains well below that needed to meet demand from newly formed households, second home buyers, and obsolescence of the existing stock of homes. Rental and homeowner vacancy rates, which are already very low, will continue to decline. This will continue to push house prices and rents up quickly. The housing shortage will be most acute for lower prices and affordable housing.

Peter Muoio, chief economist, Ten-X: Wage growth will be the key new ingredient for the housing recovery. We have been watching signs of accelerating wage growth percolate through different data sources, but 2016 will see clear and convincing evidence of rising wages. This will help with housing affordability and be the final ingredient for higher household formations and housing demand.


The other key 2016 trend will be the pace of interest rate increases. We know the Fed will pull the trigger, but the key question is how fast and strongly they continue to tighten in 2016, as that will affect mortgage rates.


tom, stachler, thomas, real, estate, one, ann arbor, michigan, saline, dexter, chelsea, homes, houses, sales, leases, condos, ypsilanti, belleville, forecast, economic, markets, listings, inventory, realtor, brokers, leading, leader, about

OUTLOOK FOR 2016 REAL ESTATE MARKET surrounding Ann Arbor

by Tom Stachler,ABR,CDPE - Group One Realty Team


It was a bit surprising to see 2015 end with a flourish of new sales contracts. We think the jump in sales activity was as much a result of mild weather as increasing buyer activity.  It would not be surprising to see that November and December sales were "borrowed" from the first quarter of 2016. Web site activity and property showings remain at similar levels as last year, which indicate we still have strong buyer interest, equal to the beginning of 2015, but not a wild market that the last 60 days might suggest. Looking back, 2015 was the year we began to move towards a more balanced market, with inventories finally rising across all market segments, faster in the upper-end but still rising in the lower price ranges as well. This past year saw value increases across all price categories, with the strongest gains in the under $250,000 segments. As shown by the Case Shiller Composite Report, the pace of increasing Home values slowed as available homes for sale increased. These national numbers mirror what we have seen throughout Michigan as well. So even with demand remaining strong, the increasing inventories will cause a cooling off of home value increases.  

This year should show similar value gains but on the lower end of the ranges we saw in 2015. The overall trends for 2016 should follow what we saw in 2015, with rising inventories, continued strong buyer demand, but probably not keeping pace with the current increase in inventories.


There is still some pent up housing demand yet to be released, probably over multiple years as opposed to all at once. Values are getting close to peak 2005 levels with 90% of Michigan home owners now with equity in their homes, a big jump over the bottom of the recession.


The recession delayed many moves, as shown by the chart below, leading up to the recession the average time between moves was 6 years and it moved to 9 during the recession. Time between moves will over time move back closer to the 7 year range, with the difference being pent-up seller demand to be released over the next few years.

The recent regulatory changes known as TRID have not had a big impact so far on getting homes sold and closed. It looks like the new regulations have extended closing dates by about a week or less.  Nonetheless, we still recommend at least 45 days from mortgage application to closing day.

All the current indicators show that housing should remain strong throughout 2016. Interest rates, although expected to rise, will remain low, mortgage lending is easing, employment and wages continue to show positive (although slow) upward trends and there is still pent-up demand from the recession left to be released. All good news. Will the current stock market correction change that? So far it appears the stock market is making the same adjustment we saw in housing in 2015, a correction to an overheated market. The old joke about the stock market is that its declines have predicted 9 of the last 5 recessions.  Certainly a fall in household net worth, whether it is from a drop in stock values or home equites, will have an impact on housing but so far it appears, with possibly the exception of the upper-end markets, the impact will not be major on housing. The momentum of the overall economy, growth of millennial home ownership and remaining pent up housing demand should carry housing through any stock market related slump.

Overall we are going into 2016 will a steady tailwind (or maybe a tail-breeze) which should keep housing moving forward at a steady pace.

Please contact me with any of your real estate needs. I am happy to assist you.


ann arbor, real estate, one, tom stachler, thomas, stahold, saline, michigan, homes, houses, for sale, Lease, rental, condos, broker, realtor, agent, sales, market, outlook, trends, 

Real Estate Home Valuation Tool Information for Ann Arbor and Surrounding Communities

by Tom Stachler,ABR,CDPE - Group One Realty Team

Looking for the Value of your Home in Michigan?

Try this Michigan Real Estate Home valuation tool to get a more accurate idea of your homes current worth that has proven to be more accurate than Zillow's Zestimate feature for instance for the tax assessor SEV or taxable value information. 

Go to www.My Price.guru to view it for yourself and if you put in your contact information, the service will send you quarterly valuation reports as well if you want.  Of course the most accurate way of getting a market report would be to drop us an email and we could provide you with a report with comps and even tweak it further with a visit to your home.  

Let us know if you have any questions or are looking to transition into another home or condo.  Just go to www.RealtyQuest.info for more information and to get the process started.  


zillow zestimate, price, home, house, ann arbor, michigan, realty, real estate, tom, stachler, value, valuation, tool, resource, get, condo, property, saline, mi, thomas, broker, estimate, assessor, records, sev, taxable, information

2014 Year End Real Estate Market Update and Pricing Trends

by Tom Stachler,ABR,CDPE - Group One Realty Team

There were no dramatic changes for the housing market in November and the first part of December. The median sale price increases in the last 90 days have been modest at under 2%, however the real value increase has been closer to 4%. The difference being that with a slowing upper price market, median values will tend to be lower than the true appreciation rate. The Month's Supply of Inventory (MSI) has been declining, with a small jump in November, a sign that although inventories are rising, demand is still strong. Sold properties have been rising through the fall season, but slowing in November compared to last year. Some of that decline might be weather-related and the fact there was one less business day in November this year. The slower sold pace does reinforce our feeling that the market is settling down to a more normal pace, especially in the over $500,000 segments. With buyers spread out among more listings, many sellers will feel that the market is slower than it really is. 

These charts from the National Association of Realtors focus on some of the underlying economic trends that should translate into a multi-year real estate recovery.


Household Net Worth at All-Time High 


Most people do not realize how far household net worth has risen from the bottom of the recession, and that it has exceeded the prior 2007 peak. The stock market jump has certainly helped move the numbers up, but the majority of the yellow bars are made up of Home equities. Higher household net worth translates into higher consumer confidence and increased consumer spending.


GDP Growth = Job Creations (8 million lost, 10 million gained)

Going hand-in-hand with increased household net worth is the increase in total jobs, again exceeding the peak year of 2007. The jobs added during this recovery are more service-based and do not have the same Buying power as those in the past, but with so many dual income families, the combined incomes create buying power for housing. Michigan as a whole may lag compared to the national averages in these two areas, but Washtenaw should actually exceed the national averages.


Young Adult Homeownership Rate (under 35 years old)

The young adult homeownership rate is one of the biggest challenges for housing growth. With tough lending standards, slow job growth and high student loan debt, young adults have a hard time getting financed. As lending standards move back to more reasonable levels, some of that first time home buyer pent-up demand will be released, moving that ownership percentage closer to 40%.


Homeowner households have not grown since 2006, but are primed to grow.

This chart clearly illustrates the effect of the housing bubble. After 20 years of growth in the number of homeowners in the U.S., we have been at a standstill for the last six years. Most economists expect the homeownership numbers to resume their growth, but probably at a slower pace than in the past. Much of that future growth is in former homeowners, who were forced to Rent, and hope to buy again the first chance they get.


National Housing Forecast

Overall, we are carrying an improved listing inventory, good economic momentum and some evidence that there is still some pent-up demand out there along with the prospects of continued affordable interest rates. The skies look good going into 2015 for stable and steady growth in the Washtenaw real estate market.


Please keep me in mind for any of your real estate needs. I am happy to assist you.


tom, stachler, thomas, real estate, market, updates, ann arbor, saline, dexter, ypsilanti, michigan, homes, houses, trend, equity, charts, bar, graph, reports, housing, prices, plot, stahold, corp, one, improving, decline, increase, decrease.

Energy-Efficient Mortgages

by Tom Stachler,ABR,CDPE - Group One Realty Team

Homeowners who are interested in improving the efficiency of their homes can consider taking out an energy-efficient mortgages. Energy-efficient mortgages are loans that can be taken out to finance upgrades on a Home that will benefit both the homeowner and the community by working to reduce the carbon footprint of the property. Typically, expenses involved with making the upgrades are added to the overall mortgage loan so that additional loans do not need to be taken out by the homeowner to make the upgrades.

An important aspect of an energy-efficient mortgage (or an EEM) is that they can feature exceptions to debt-to-income rules that restrict homeowners from taking out additional financing. Therefore, a homeowner who takes at an EEM can borrow more money to put toward his or her home than would be possible through a traditional mortgage. These exceptions are justified due to the fact that- despite the fact that initial expenses will be higher- the EEM should reduce the cost of living in the home and maintaining the home over time. However, taking out an EEM requires an energy audit carried out by a recognized expert to prove the benefits of the proposed energy-efficient upgrades.

There are three types of EEMs: the conventional EEM, the Federal Housing Administration (FHA) EEM, and the Veterans Administration (VA) EEMs. Below is an explanation of each type.

  • Conventional EEMs- This is the most common of all of the different EEMs. When a lender is determining whether or not a given energy-efficiency update can be financed, that lender can factor the future energy savings that will be brought about by the update into the borrower's income when determining the borrower's debt-to-income ratio. In this way, the homeowner can borrow more money and still be within applicable debt-to-income rules.
  • FHA EEMs- There are a variety of different underwriting conditions that need to be met for a homeowner to take out a FHA EEM. Through this type of EEM, the homeowner can borrow whichever amount is less: the overall expenses involved with the improvements/inspections, or the lesser amount of either 5 percent of the property's value, 115 percent of the median price on a single family home in the area, or 150 percent of the loan limit specified by Freddie Mac.
  • VA EEMs- This type of EEM is available to qualifying veterans, and it can consist of a loan of anywhere between $3,000 and $6,000.

Mortgage Changes to Know in 2014

by Tom Stachler,ABR,CDPE - Group One Realty Team

To follow up from my previous post about FHA mortgage limit changes this year, there are some additional mortgage changes to know in 2014. Buyers who are looking to purchase a new Home need to be aware of current changes in mortgage rules in order to choose the loan that is best for them.

One of the biggest changes involves FHA loan limits. The maximum amount of an FHA loan decreased from $729,750 to $625,000 beginning January 1, 2014. A number of counties across the country saw significant decreases, as the loan limits are based upon median home prices in a given area. The expiration of credits given by the Housing and Economic Reform Act of 2008 has resulted in the agency now approving 115% of the median Home Price in a given area as opposed to 125% previously.

The Consumer Financial Protection Bureau (CFPB) now requires lenders to follow an “ability to repay” mandate when approving loans. This new regulation requires that lenders follow a precise set of guidelines when it comes to calculating income, debt and assets. In doing so, they are granting what the government deems to be a “qualified mortgage” in an effort to reduce the number of foreclosures that take place in the future.

Self-employed workers face even more difficulty when it comes to obtaining a “qualified mortgage” than others will. That’s because the new rules make it more difficult for people without a W-2 form to prove their debt-to-income ratio than it is for others. This is true even for those who have extremely high credit scores and a high net worth. It seems that the government is concerned that tax write-offs will reduce the amount of taxable income a person earns, thereby making income statements less accurate than W2 forms.

Some positive mortgage changes stem with new caps placed on loan origination fees. Those who obtain a qualified mortgage are limited to no more than three percent of the loan amount for points and fees charged by the lenders. Unfortunately, there is no cap on origination fees for consumers who do not obtain a qualified mortgage.

As always, buyers should check with their lender to find out about specific changes that are mandatory by a particular institution.

Michigan Monthly Market Report - September 2013

by Tom Stachler,ABR,CDPE - Group One Realty Team

Michigan Monthly Market Report - September 2013   

August continued the trend we outlined last month in each geographic area and price range with the market continuing to improve over last year, but at a slower rate. The pace of sales and of new listings entering the market are increasing and values are improving. New buyers are still outrunning new listings, so inventories continue to fall (with the exception of Washtenaw County and Northwest Michigan, where inventories have risen slightly).  

The overall Months Supply of Inventory hit another record low at two months and values have risen to a five-year high. Some select markets are approaching their peak 2005 values. This is, of course, all a result of what is really an overheated market. A market that moves too far ahead of the pace of the overall economy will eventually be headed for a fall, so the waning of this crazy pace to a more normal growth rate is good news for all. 

The Fall starts the seasonal slow down for Home sales so we can expect fewer multiple offers. We will still see the vast majority of homes (over 85%) sell within 90 days or less. For Buyers in a bidding war, our rule of thumb has been, “as long as the offer is at or below the peak 2005 value, the overbid is a safe bet.”

I have included two charts, Comerica’s local economic trend and the latest Case-Shiller value trend. Both show good news for housing and our local economy.

The Comerica Michigan Economic Activity Index continues to show strong growth through this summer, surpassing the prior 2007/08 high points. This represents the fuel for sustaining our local housing growth trends.

Case-Shiller shows Detroit with one of the highest year-over-year value growth rates. Although we are the only major city still below our 2000 value baseline, that is heavily influenced by the decline in values for the city of Detroit (the good news is city values are rising quickly again). The typical Southeast Michigan market is at or above 2000 values.

With Fall quickly approaching, I want to thank you for your support and interest this past summer season.


Interested in new listing updates?  Just click on the link above "Get Listing Updates" to receive new listings the day they come out automatically.  You can also contact us by using one of the options found after clicking on our home button above or call our office direct line at 734-996-0000 and ask for Tom Stachler.


PURCHASE REAL ESTATE WITH YOUR IRA

by Tom Stachler,ABR,CDPE - Group One Realty Team
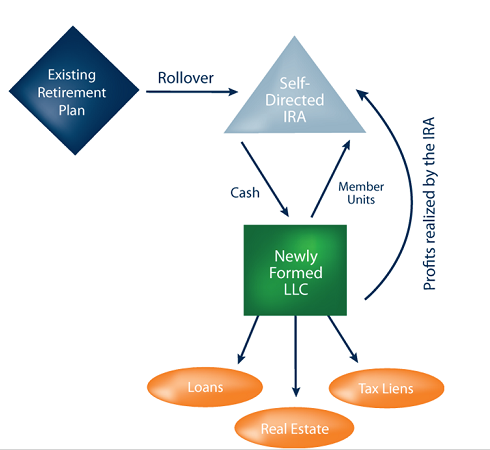
A self-directed IRA is used for real estate investing.

A self-directed IRA is used for real estate investing.

If you have been frustrated over the performance of your IRA investments in stocks, bonds or mutual funds, investing your IRA funds in real estate may be a desirable alternative. 


IRAs can be used to purchase real estate of any type, such as a single-family Home, commercial building or even raw land. However, there are rules and limitations regarding how IRA-owned real estate can be purchased and used. Violating these rules can result in adverse tax consequences.


Self-Directed IRA

Although IRS rules permit IRA funds to be invested in real estate, IRS rules do not require an IRA trustee to offer real estate as an investment option. Most trustees who offer traditional IRA investments, such as depository banks, do not allow an IRA owner to invest in real estate because of the extra administrative burden of real estate management. As a result, if you want to invest your IRA funds in real estate, you will most likely have to convert your traditional IRA to a self-directed IRA—which is an IRA that requires you to decide what investments to make, such as real estate. In general, you can establish a self-directed IRA with a nondepository bank or trust company.

Prohibited Transactions

IRS rules require IRA-owned real estate to be for investment purposes only. This requirement places several prohibitions on how the real estate can be purchased and used. Key to understanding the prohibitions is the term “disqualified persons.” This term is used in the IRS rules regarding IRA-owned real estate to refer to the IRA owner and related persons--that is, the IRA owner and spouse, ancestors (mother, father, grandparents) and descendents (children, grandchildren and their spouses). The term disqualified person also includes the IRA-owner & investment advisers, including a trustee of the IRA funds, and any business in which a disqualified person has a 50 percent or greater interest. IRS rules prohibit the use of IRA funds to purchase real estate from a disqualified person. The rules also prohibit a disqualified person from using any real estate purchased with IRA funds, either as a home or business. These rules even preclude you from purchasing a vacation home that is only partly for personal use and otherwise rented to others.

Financing Issues: UDFI Tax

If you use all cash to purchase your IRA-investment real estate, the income produced by the property and the gain from a future sale of the property will remain in your IRA tax-deferred until you start taking distributions. However, if you acquire a mortgage as part of your purchase of the real estate, you will have to pay taxes on any income or gain attributable to the financed part of the transaction, called Unrelated Debt Financed Income, or UDFI. With regard to a mortgage, you must also keep in mind that you cannot guarantee repayment of the mortgage, as this would violate the disqualified person rule. This may require you to use another property as additional security for the lender or pay a higher interest rate and other costs.

Tax Consequences

If you violate the IRS rules regarding prohibited transactions, the IRS will consider the IRA funds used in the transaction as a distribution of your IRA. You will be taxed on the funds from the first year in which the transaction occurred, with penalties and interest included. Depending on your age, you may also incur an additional penalty for taking an early distribution.

Image Loading


Check out the "ALL MLS LISTINGS"  link above to search for income and owner occupied real estate options.  


Contact our office with any questions.  


how to purchase real estate using your ira account.  buy income property using an ira. information on how to use your ira to purchase real estate. ann arbor real estate for sale using your ira account. tom stachler with real estate one can help you make the right investment and real estate purchase decisions. real estate one ann arbor michigan saline dexter ypsilanti realty to purchase

Displaying blog entries 21-30 of 45

Syndication

Categories

Archives